Organizations track revenue, expenses, and project deadlines with increasing precision. Yet many still struggle to answer a surprisingly simple question:
Do we truly know where our people are spending their time and what that work is costing us?
For project-based organizations, labor is often one of the largest operating expenses and a primary driver of service delivery. Whether you’re running an engineering firm, consulting practice, nonprofit, IT services company, staffing agency, or professional services business, your success depends on how effectively people are allocated, utilized, and managed.
The financial implications are significant. According to SPI Research’s 2026 Professional Services Maturity Benchmark, average billable utilization fell to 66.4% in 2025, its lowest level in the study’s 19-year history. The benchmark also found that average earnings before interest, taxes, depreciation, and amortization (EBITDA) remained at 9.9%, well below the five-year average of 13.8% [1].
These figures highlight the challenges project-based organizations face in converting employee effort into profitable business outcomes. Yet labor data is often scattered across time-tracking tools, HR systems, project management software, spreadsheets, and accounting platforms.
The result is a lack of labor visibility that can impact profitability, forecasting, staffing decisions, and long-term growth.
What Is Labor Visibility?
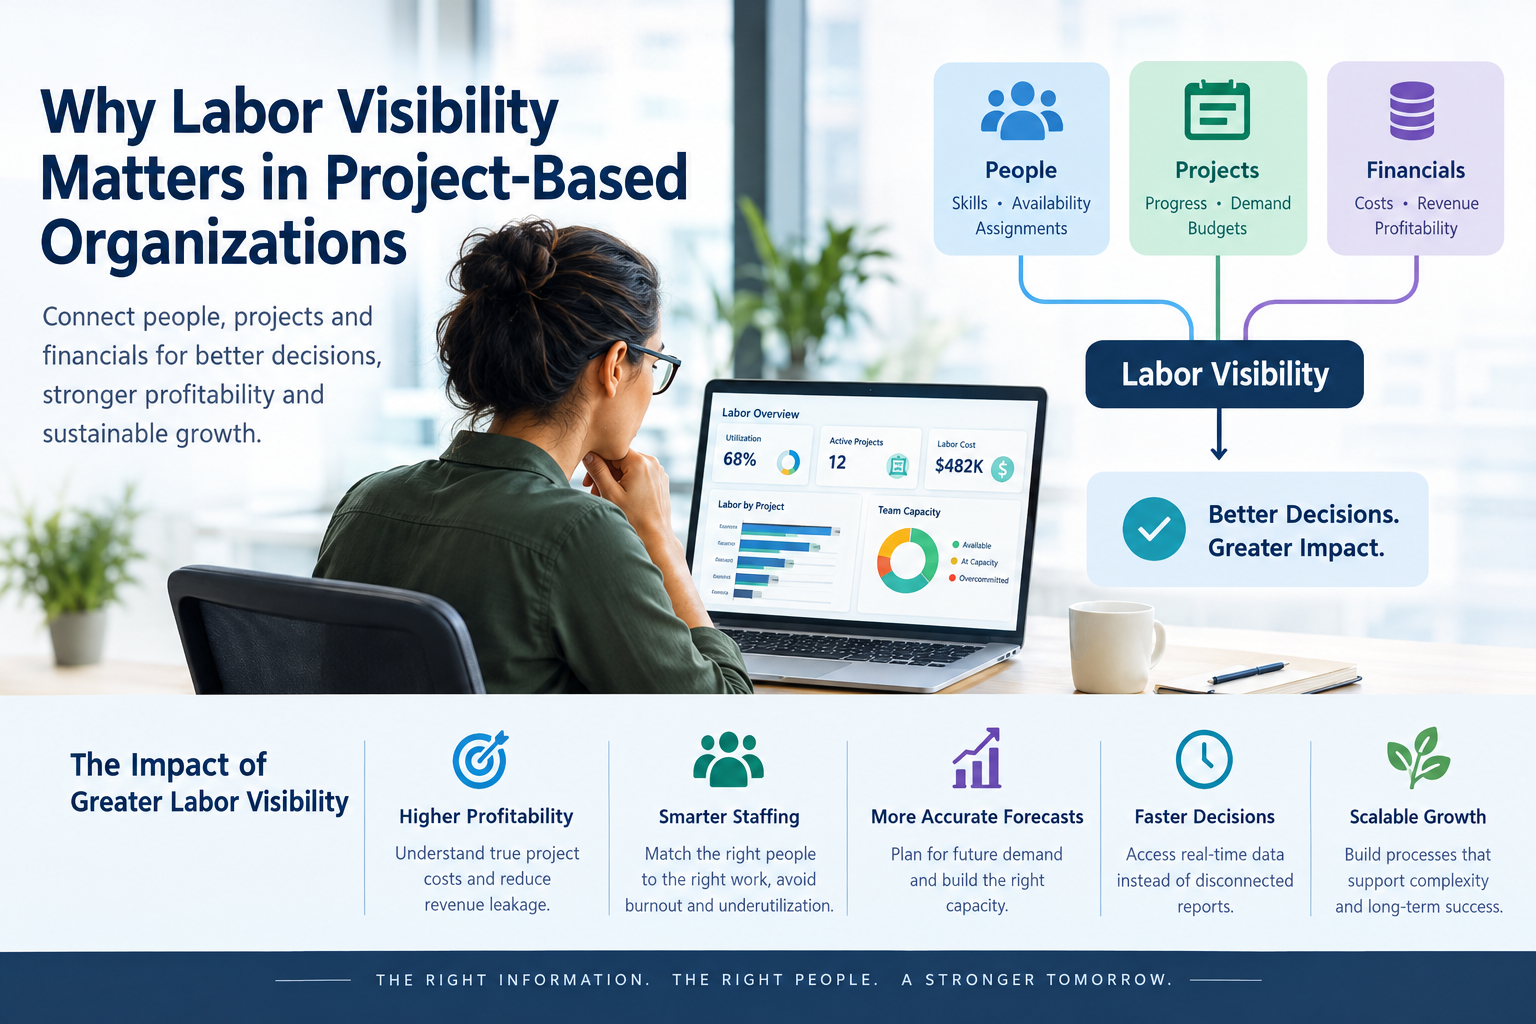
Labor visibility is the ability to understand how employee time, effort, and costs are allocated across projects, departments, programs, clients, and business activities.
It provides leaders with a clear picture of:
- Who is working on what
- How much work is being performed
- What labor is costing the organization
- Which projects are consuming the most resources
- Whether teams have available capacity
- How labor impacts financial performance
Without labor visibility, organizations often rely on assumptions instead of data. A project might appear successful because revenue is growing, while labor costs quietly erode profit margins behind the scenes. Similarly, a department may appear adequately staffed until overlapping assignments, unrecorded work, or unexpected project demands expose capacity constraints.
Labor visibility helps organizations connect workforce activity to operational and financial performance.
Why Labor Visibility Has Become More Important
A decade ago, many organizations operated with smaller teams, fewer locations, and less complexity.
Today, many organizations manage
- Hybrid and remote workforces
- Multiple offices or service locations
- Full-time employees and contractors
- Cross-functional project teams
- Numerous customers, grants, programs, or projects
As organizations grow, visibility becomes harder to maintain.
The challenge is not necessarily a lack of data. Most organizations have plenty of data. The challenge is that the data lives in different systems that do not communicate effectively with one another.
- HR knows who was hired.
- Project managers know what work is being performed.
- Accounting knows what labor costs.
- Leadership often struggles to see how all three connect.
Industry benchmarks reinforce the importance of addressing this gap. SPI Research’s 2024 Professional Services Maturity Benchmark found that high-performing professional services organizations generated 31% more annual revenue per billable consultant than the broader comparison group [2].
Revenue per consultant is influenced by several factors, including pricing, project mix, demand, and operational efficiency. Nevertheless, it provides a useful illustration of why organizations need to understand how workforce capacity translates into business results. When organizations can connect employee time, project assignments, and labor costs, they are better positioned to identify inefficiencies and make informed decisions about how resources are deployed.
Five Business Problems Caused by Poor Labor Visibility
1. Inaccurate Project Profitability
Revenue tells only part of the story.
A project may appear healthy from a billing perspective while consuming significantly more labor than originally planned.
For example, a consulting engagement may generate $200,000 in revenue but require substantially more employee hours than anticipated. If actual labor costs are not visible at the project level, managers may not recognize the margin problem until the engagement is complete. This is particularly important for organizations that operate on fixed-fee contracts, where additional labor does not necessarily translate into additional revenue.
The financial impact can extend beyond individual projects. SPI Research’s 2026 benchmark indicates that professional services organizations lose approximately 4.5% of revenue to revenue leakage on average, while leading firms keep losses below 3% [3].
Revenue leakage can stem from several issues, including missed billable hours, unbilled work, contract compliance problems, and billing errors. Poor labor visibility can contribute to some of these challenges by making it harder to reconcile work performed with work billed.
Without accurate labor data, organizations risk discovering profitability problems after corrective action would have been most effective.
2. Resource Allocation Becomes Difficult
Managers frequently face staffing questions such as:
- Who has available capacity?
- Should we hire?
- Can we take on another project?
- Which team is overcommitted?
- Can an existing employee support a new client engagement?
Organizations lacking labor visibility often answer these questions through anecdotal feedback instead of objective data. This can lead to employee burnout in some areas while others remain underutilized.
For example, a manager may request another full-time employee because the team appears overwhelmed. However, a more detailed view of project assignments and actual hours might reveal that the issue is uneven workload distribution rather than insufficient headcount.
The opposite can also happen. An organization may delay hiring because employees appear available, only to discover that those employees lack the skills, certifications, or availability needed for upcoming work.
Understanding resource capacity alongside skills, assignments, and project demand helps managers make better staffing decisions.
3. Forecasting Turns Into Guesswork
Growth requires planning.
Leaders need to understand future staffing requirements, expected workloads, and organizational capacity. Without accurate labor information, workforce planning becomes reactive rather than proactive.
- Hiring decisions are delayed.
- Projects become understaffed.
- Teams become overloaded.
All of these issues can affect performance and customer satisfaction. The relationship between operational visibility and forecasting is reflected in SPI Research’s 2024 benchmark. High-performing professional services organizations demonstrated 28% higher forecasting accuracy than the broader comparison group [2].
This finding does not mean that labor visibility alone produces more accurate forecasts. It does, however, reinforce the importance of having reliable operational information available when planning future demand and capacity. By comparing planned labor against actual effort, organizations can identify recurring patterns, improve project estimates, and make more informed decisions about hiring and resource allocation.
4. Decision-Making Slows Down
Many organizations spend significant time simply gathering information.
- Managers request reports.
- Finance pulls spreadsheets.
- Project leaders export data.
- Operations consolidates information.
By the time leaders receive the report, the information may already be outdated.
When labor data exists across disconnected systems, reporting becomes an administrative exercise rather than a strategic tool.
SPI Research’s 2024 benchmarking findings also showed that high-performing organizations reported 23% higher executive real-time visibility than their peers [2].
Timely access to operational information helps leaders identify emerging issues before they become larger problems. Instead of waiting for month-end reports to reveal that a project is over budget, managers can review labor trends and investigate variances while the project is still underway. The goal is not simply to produce more reports. It is to make useful information available when decisions need to be made.
5. Growth Creates Operational Chaos
Growth is exciting. A new client, project, grant, service offering, or office location usually represents success.
But growth also introduces complexity.
More projects mean more staffing requirements.
More employees mean more onboarding and resource planning.
More customers mean more operational oversight.
Organizations that lack labor visibility often discover that their processes do not scale as efficiently as their revenue does. A team that can manage five projects through informal communication and spreadsheets may struggle to coordinate 25 projects across multiple departments and locations.
As complexity increases, disconnected processes make it harder to maintain consistent reporting, understand labor costs, and identify capacity constraints. Establishing a reliable view of workforce activity early helps organizations build processes that can support growth without introducing unnecessary administrative work.
What High-Performing Organizations Do Differently
Organizations with strong labor visibility share a common trait: they view workforce data as an operational asset rather than an administrative function.
SPI Research’s 2024 benchmark found that professional services organizations using professional services technology achieved 28% higher EBITDA percentages, 14% higher project margins, and 10% higher employee billable utilization than organizations not using that technology [4].
These results represent differences observed between groups, not guaranteed improvements from implementing a particular system. However, they illustrate the potential business value of using technology to improve operational visibility and efficiency.
High-performing organizations typically focus on three areas.
They Centralize Workforce Information
Instead of maintaining information across multiple disconnected tools, they create a shared view of:
- Employees
- Skills and certifications
- Availability
- Assignments
- Utilization
This allows managers to make staffing decisions based on more consistent information rather than assumptions. Centralization does not necessarily mean replacing every existing system. In some cases, integrating existing platforms and establishing consistent data definitions can provide the visibility leadership needs.
They Connect People to Projects
Understanding labor requires more than knowing who is employed. Organizations need visibility into how people connect to actual work. When employee time and assignments are linked to projects, leaders gain a clearer understanding of:
- Resource demand
- Project progress
- Labor costs
- Capacity constraints
- Planned versus actual effort
This connection is especially important for organizations managing multiple projects, client engagements, contracts, or grant-funded programs.
It allows leaders to evaluate not only how much work is being performed, but also whether the right resources are being allocated to the right activities.
They Monitor Labor Performance Regularly
Monthly reporting is valuable, but waiting until month-end to identify a problem can limit the available options for addressing it. Organizations with stronger operational processes monitor labor performance frequently enough to identify emerging issues and respond appropriately.
For example, managers can review whether actual labor hours are exceeding project estimates, whether employees are being assigned beyond their available capacity, or whether anticipated demand will require additional staffing. The objective is to identify meaningful deviations early and take corrective action before they significantly affect project outcomes.
Key Metrics Every Organization Should Monitor
Improving labor visibility starts with measuring the right information. Not every metric applies equally to every organization. A consulting firm may focus on billable utilization, while a nonprofit may prioritize program labor costs and grant allocation. The most useful metrics are those aligned with the organization’s operating model and financial objectives.
Utilization Rate
Utilization measures how much available working time is spent on productive or billable work, depending on the organization’s definition.
SPI Research reported average billable utilization of 66.4% in 2025 among professional services organizations [1]. This provides a useful benchmark for comparable firms, but it should not be treated as a universal target. Utilization expectations vary by role, industry, contract structure, and the amount of time employees are expected to devote to administrative work, training, and business development.
Low utilization may indicate excess capacity or weak demand. Extremely high utilization may signal limited flexibility, insufficient coverage, or burnout risk.
Resource Capacity
Capacity helps organizations understand who is available for additional work and who may already be overcommitted.
Effective capacity planning considers scheduled hours, existing assignments, skills, leave, and upcoming project demand. This metric is particularly important for organizations evaluating new contracts or deciding whether to hire additional employees.
Labor Cost by Project
Understanding labor cost at the project level provides a clearer picture of profitability and operational efficiency. Organizations should be able to compare planned labor costs with actual costs and understand which projects, clients, or activities consume the most resources.
For organizations with multiple billing models, it is also important to distinguish billable work from nonbillable activities and to understand how those activities affect project margins.
Labor Variance
Labor variance compares planned labor effort or cost against actual results.
For example, if a project was estimated to require 500 labor hours but ultimately requires 650, the organization has a 150-hour unfavorable variance.
Investigating that variance can help uncover scope changes, inaccurate estimates, inefficient processes, or unexpected project requirements. Over time, this information can improve estimating accuracy and project planning.
Revenue Per Employee
Revenue per employee provides insight into how effectively an organization converts its workforce into revenue. For project-based organizations, revenue per billable consultant can provide a more targeted measure of delivery productivity.
SPI Research’s 2024 benchmark found that high-performing professional services organizations generated 31% more annual revenue per billable consultant than the broader comparison group [2].
This metric should be considered alongside profitability, service quality, and employee workload. Higher revenue per employee does not automatically mean an organization is more efficient if it comes at the expense of quality or sustainable working conditions.
The Problem Is Not Labor. It’s Visibility.
Most organizations do not struggle because they lack talented people.
They struggle because information about those people is fragmented.
When workforce data exists in one system, project information in another, and financial reporting somewhere else, leaders lose the visibility needed to make informed decisions. The consequences can extend across the business, affecting profitability, forecasting, project execution, employee engagement, and growth.
Industry benchmarking suggests that organizations with stronger operational performance and more effective use of professional services technology often achieve better financial and delivery outcomes. The opportunity is to understand which practices and tools can help an organization close its own performance gaps.
Labor visibility is not simply an HR issue. It is an operational issue.
By connecting people, projects, time, and financial information, organizations can develop a clearer picture of how work is performed, where resources are consumed, and how operational decisions affect business results.
As teams grow and projects become more complex, the ability to connect workforce activity to financial performance becomes increasingly important.
Organizations that understand where their labor goes are better equipped to decide where it should go next.
Frequently Asked Questions
What is labor visibility?
Labor visibility is the ability to understand how employee time, effort, and costs are allocated across projects, departments, and business activities.
Why is labor visibility important?
Labor visibility helps organizations improve staffing decisions, manage growth, forecast workforce needs, and better understand project profitability.
How do organizations improve labor visibility?
Organizations typically improve labor visibility by connecting workforce, project, time-tracking, and financial information into a unified view. This can involve integrating existing systems, standardizing reporting practices, or implementing workforce and project management technology.
What causes labor visibility problems?
Common causes include disconnected systems, spreadsheet-based processes, manual reporting, rapid growth, inconsistent data management practices, and a lack of standardized project and labor reporting.
How does labor visibility affect profitability?
Labor visibility helps organizations understand project costs more accurately, identify inefficiencies, allocate resources effectively, and investigate margin issues before they become more difficult to address. Its impact depends on how effectively leaders use the information to make operational decisions.
What metrics are commonly used to measure labor visibility?
Common metrics include utilization rate, resource capacity, labor cost by project, labor variance, and revenue per employee. Organizations should select metrics that align with their business model and strategic objectives.
References
- Deltek. (2026, July 30). 2026 PSO Benchmarks: Insights from SPI Benchmark Maturity Report.
https://www.deltek.com/resources/articles/professional-services-benchmarks/ - Planview / SPI Research. (2024). 2024 Professional Services Benchmarking Report.
https://info.planview.com/Professional-Services-Maturity-Benchmark-_report_psa_en_reg.html - Deltek. (2026). 5 KPIs from the SPI Professional Services Maturity Benchmark Report Every PSO Must Track for Sustainable Growth.
https://www.deltek.com/resources/articles/5-kpis-from-the-spi-professional-services-maturity-benchmark-report-every-pso-must-track-for-sustainable-growth/ - Kantata / SPI Research. (2024). 2024 Professional Services Maturity Benchmark.
https://www.kantata.com/resource/2024-professional-services-maturity-benchmark
Note: These benchmarks focus primarily on professional services organizations. Results may not generalize directly to every project-based organization. Differences between high-performing and average organizations are associations, not proof that any single technology or practice causes the reported outcomes.